Introducing IDAscope
About a week ago, I already announced on Twitter the progress for the IDA plugin called “IDAscope” Alex and I are currently working on, showing a screenshot. In this post, I want to roll out some basic thoughts on the idea behind the plugin and its motivation.
I feel that there is still a lot of potential for visually exploring the data contained in a binary being subject to analysis. And be it just by providing certain overviews that are not available by the stock versions of our analysis tools.
About a year ago, I started off with a little script that tagged unexplored (i.e. not renamed) functions with a short semantic description on what I assume is happening inside based on API calls.
If there are calls to, let’s say ws2_32!connect, ws2_32!send, ws2_32!receive there would be an extension of net to the default name sub_c0ffee, yielding the name net_sub_c0ffee.
However, sorting by function names with the standard Funtion Window of IDA is unsatisfactory, as sorting by tags is just not possible.
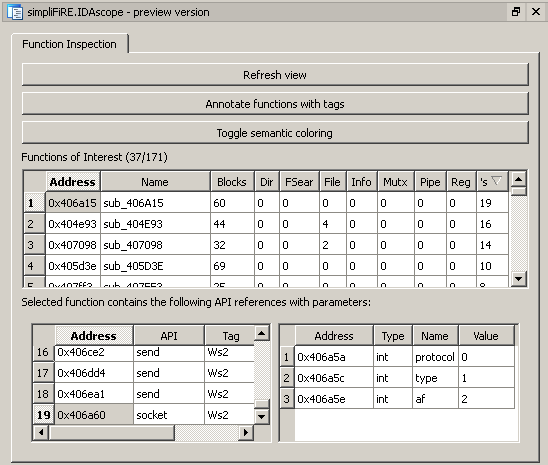
That brought up that I would need some kind of custom table visualization, like the one you might have already seen in my tweet.
Here is the screenshot, so you don’t have to click anything:
I read a MindShaRE blog post by Aaron Portnoy on his journey with IDA/PySide and it was some kind of a door opener for me, as it showed me what would actually be possible by building own GUI extensions. By that time, I started working on the plugin but was thrown back when Aaron and Brandon announced Toolbag, which already in the Beta seemed to be a powerful implementation extending IDA with a lot of features that come in handy. REcon set me back on track and now I am motivated again to pursue my plugin as I noticed that the focus of my plugin is different from theirs. The feedback of Alex also put in a lot of motivation, helping me to continue.
So after the REstart, the next step was to take the basic existing script as mentioned before and embedding it in some optimized graphic front end, resulting in the GUI as shown here:
Having an overview of the tagged functions was just one step, having the relevant API calls responsible for the tag was a logical consequence. Right now, I am working on extracting the parameters to these function calls. For this, some basic data flow analysis is needed of course.
To support my point, I want to introduce you to my favorite malware sample: 92a1ad5bb921d59d5537aa45a2bde798. This is a very simple Spybot variant with timestamp of 2003, which I believe to be its true date. It’s one of my standard samples used to teach RE at university. The sample is a good read and nice to study if you are new to malware analysis. Funny sidenote: it is only detected by 37/42 AVs on VirusTotal, despite having no protection, obfuscation, whatsoever.
From the 231 API calls tagged by IDAscope, the parameters to these API calls have pushes of the following type (bold: easily extractable):
- General Register: 287
- Immediate Value: 263
- Memory Reg
[Base Reg + Index Reg + Displacement]: 83 - Direct Memory Reference to Data: 21
This means that 60% of the parameters can be potentially resolved via data flow analysis, providing a more interesting value than eax or [0x405004] as it is in the current state of development.
While this is only one example, I am confident that putting the effort into data flow analysis is worth it as it opens doors to other interesting use cases.
But even for the immediates there are more possibilities. Many of them can be further resolved as shown in the following example.
Think of:
push 0
push 1
push 2
call socket
a typical constellation as shown to you by IDA Pro.
By knowing the type of the parameter and the immediate value, we can directly resolve those to:
push IPPROTO_IP
push SOCK_STREAM
push AF_INET
call socket
which nets us the information that it is a TCP connection based on IP.
While these are probably values you know by heart anyway, there is still a lot of moments where I find myself looking into MSDN in order to figure out what exactly is happening with this or that API call.
Long-term, I want to have some functionality for looking up APIs, structs and types via MSDN directly integrated into the plugin. I know that there are scripts by others that do this already, but often combination of features leads to emergence.
Another feature that is already integrated and that was shown in the tweet was the coloring of basic blocks based on the semantic type of the tag. Once you are used to the colors, this can really speed up navigation in a function using the Graph overview.
For my config, I use the following six colors:
- yellow for memory manipulation
- orange for file manipulation
- red for registry manipulation
- violet for execution manipulation
- blue for network operations
- green for cryptography
Right now, the highlighting is implemented in a 3-way cycle: use 6 colors, use standard color (all red), disable. Disabling is important because I noticed that you can also get to a point where you focus too hard on the colors and might miss other important spots.
We will not commit to any kind of release date as there is still a lot of ideas that might find their way into the first, official release. However, if you are interested or want to share ideas for features, let us know and we will see what we can do.
Alex will probably blog in the next days about another aspect of functionality that will find its way into the plugin, introducing a second tab.
Stay tuned for more news on IDAscope. :)

